These are some recent examples of my data journalism and polling work. You can find a complete list of my bylines here and a list of my academic publications here.
Silver Bulletin presidential approval average
.png)
I run the Silver Bulletin’s presidential approval aveage with Nate Silver. The average uses data from all publicly available public opinion polls to estimate Donald Trump’s approval rating. I designed and maintain our database of public opinon polls, created the charts for our dashboard, and am responsible for updating the average multiple times per-day. I also track data on Trump’s approval on various issues like immigration and the economy, and run a polling averages that seperates our strong and weak approval.
Silver Bulletin 2024 presidential election forecast
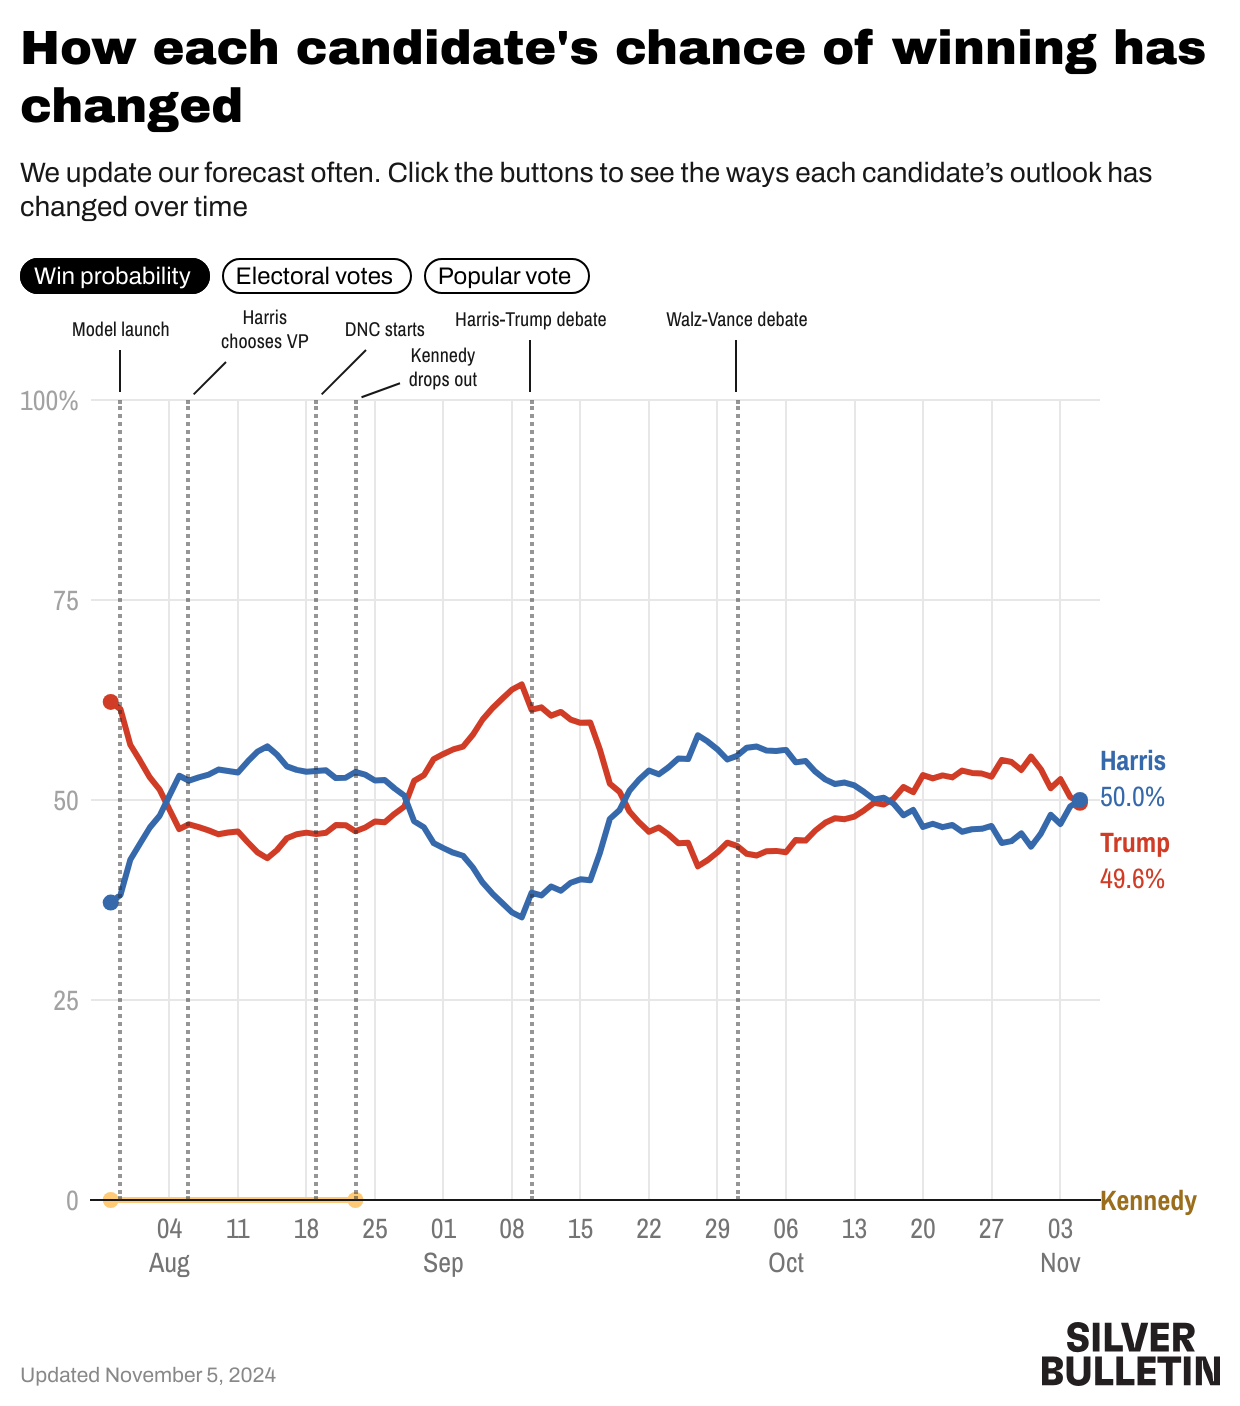
I also ran the Silver Bulletin’s 2024 forecast for the U.S. presidential election with Nate Silver. The model combines public opinion polls with demographic and economic data to simulate thousands of potential election outcomes and forecast the winner of the Electoral College. I designed the charts for our polling average and forecast, maintained our database of public opinion polls, and created a fully automated system for updating our charts with new data. Our forecast was one of the most accurate in 2024 and exactly predicted the most likely election map.
Silver Bulletin pollster ratings
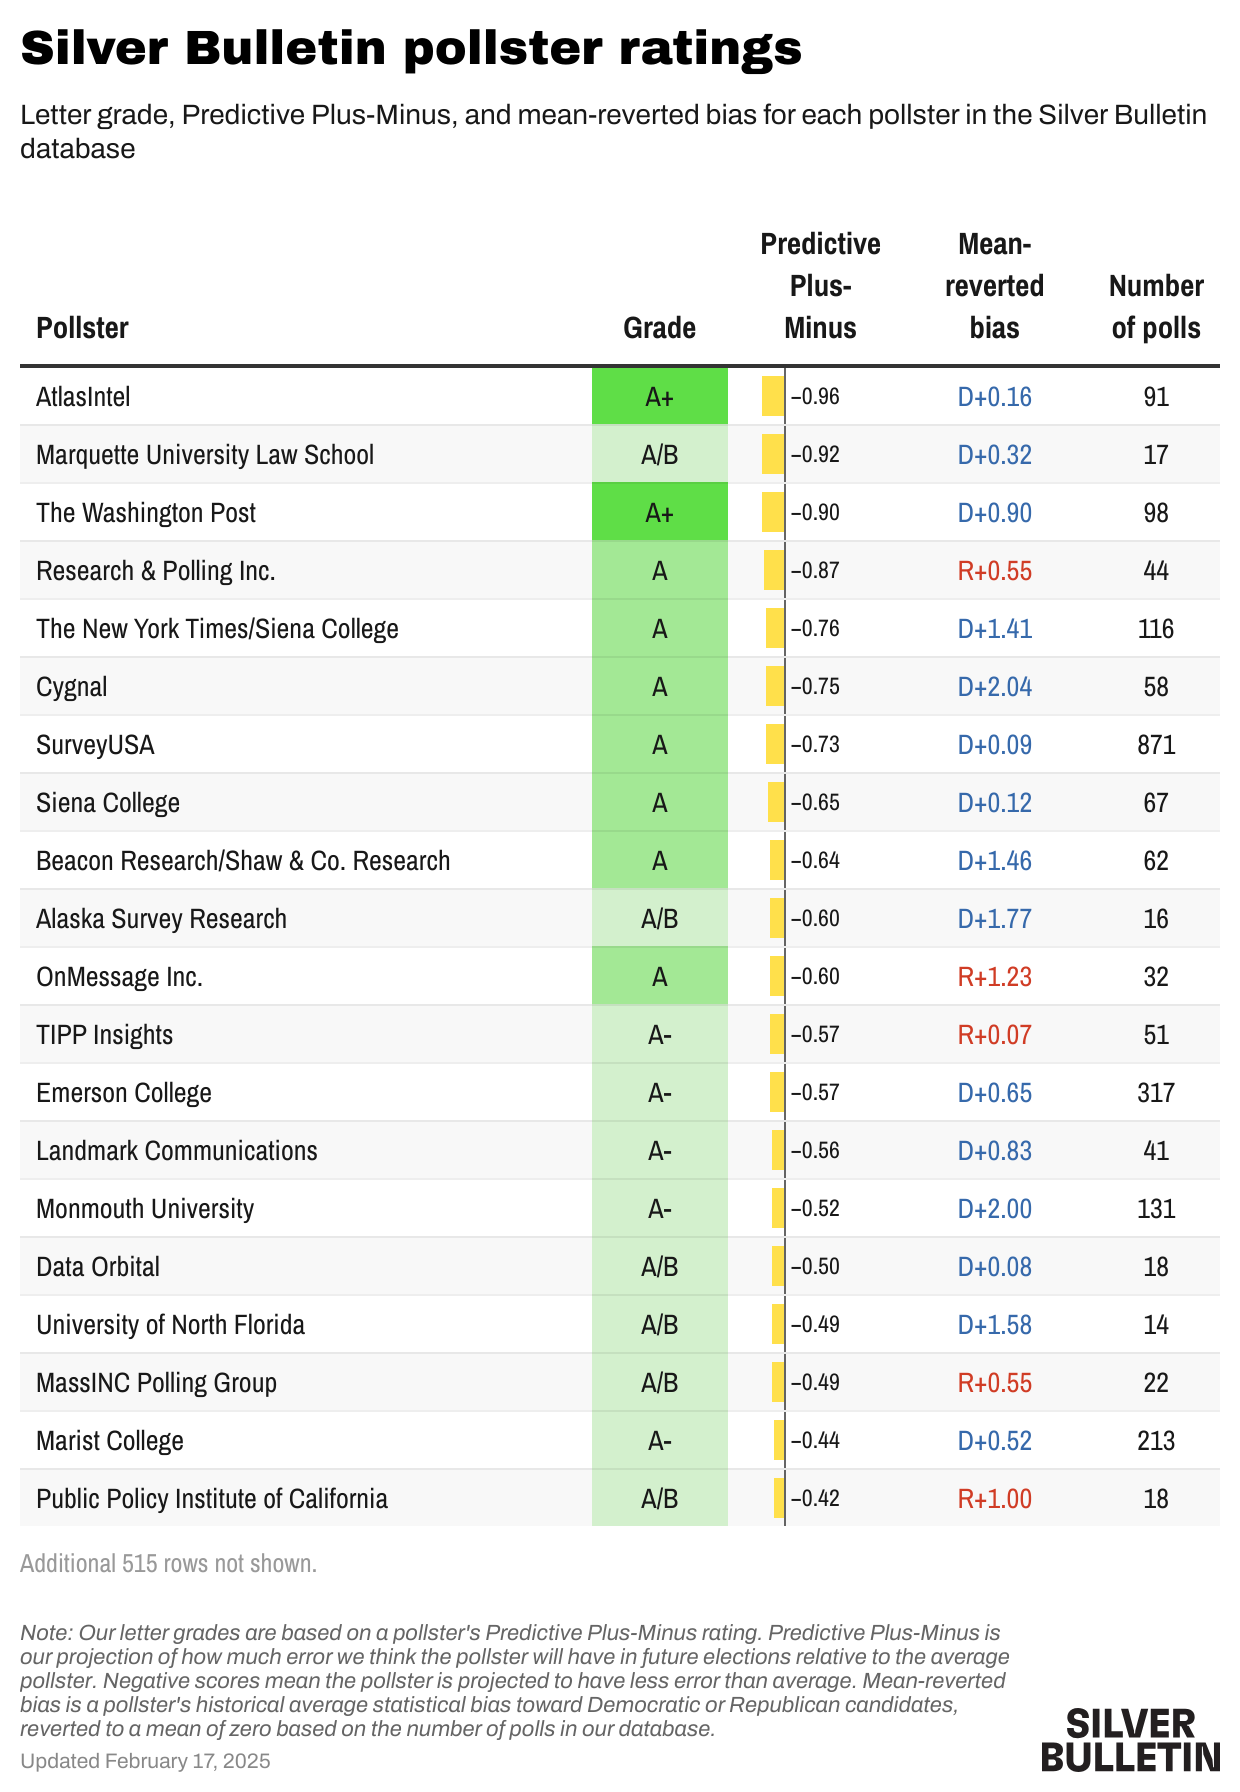
Nate Silver and I maintain the Silver Bulletin pollster ratings. We compile every election poll conducted by U.S. pollsters within three weeks of a presidential primary or general election and use them to grade pollsters based on their historical accuracy and transparency. I collected the data for our post-2024 update to the ratings designed our pollster rating charts. I also wrote the Silver Bulletin’s retrospective piece on how the polls performed in 2024.
The polls are close, but that doesn’t mean the results will be
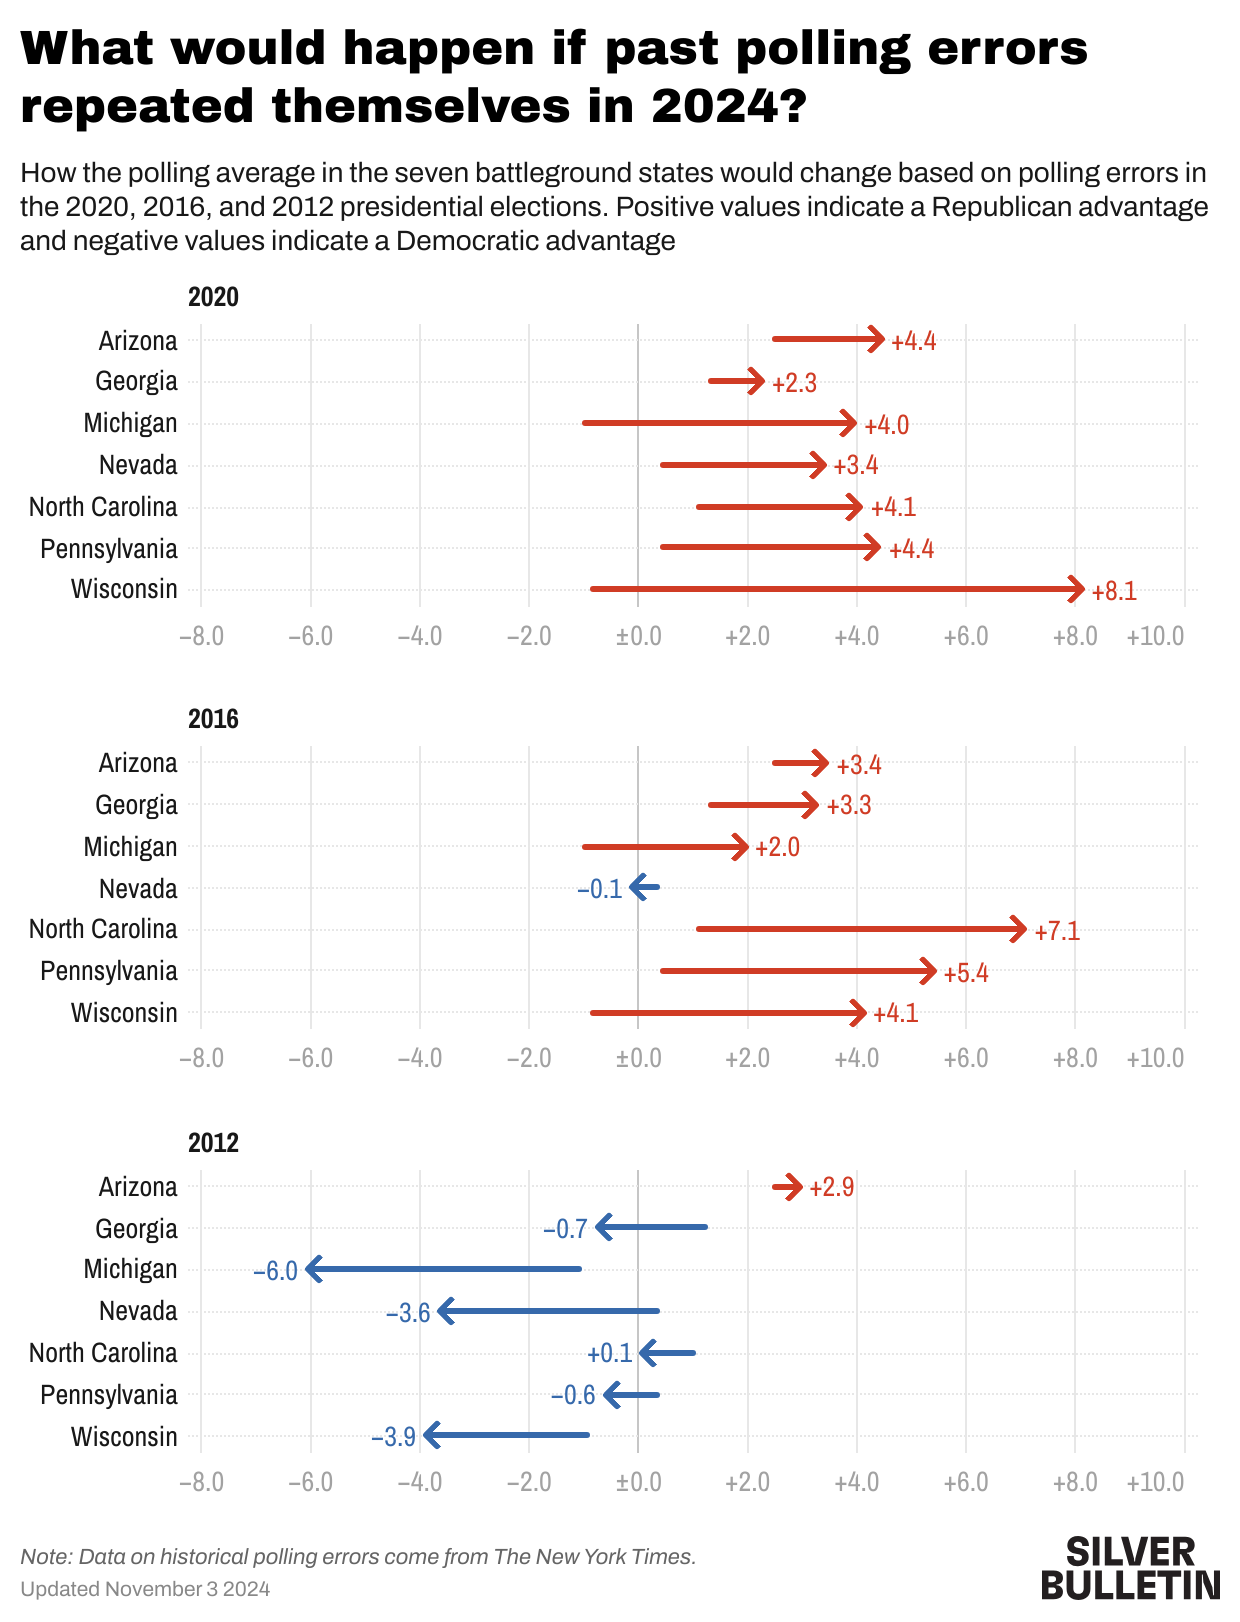
“So what’s the point of our forecast if things are so close that standard behavior from the polls means either candidate could win decisively? Basically to tell you exactly that. Divorced from vibes and bad punditry, the data say the race is a tossup. Either candidate could win and with a normal polling error, either candidate could win by a lot. Our advice is to embrace uncertainty and to not be too surprised if the breakdown of who wins each state doesn’t neatly follow the current polling averages.”
Are Republican pollsters “flooding the zone?”
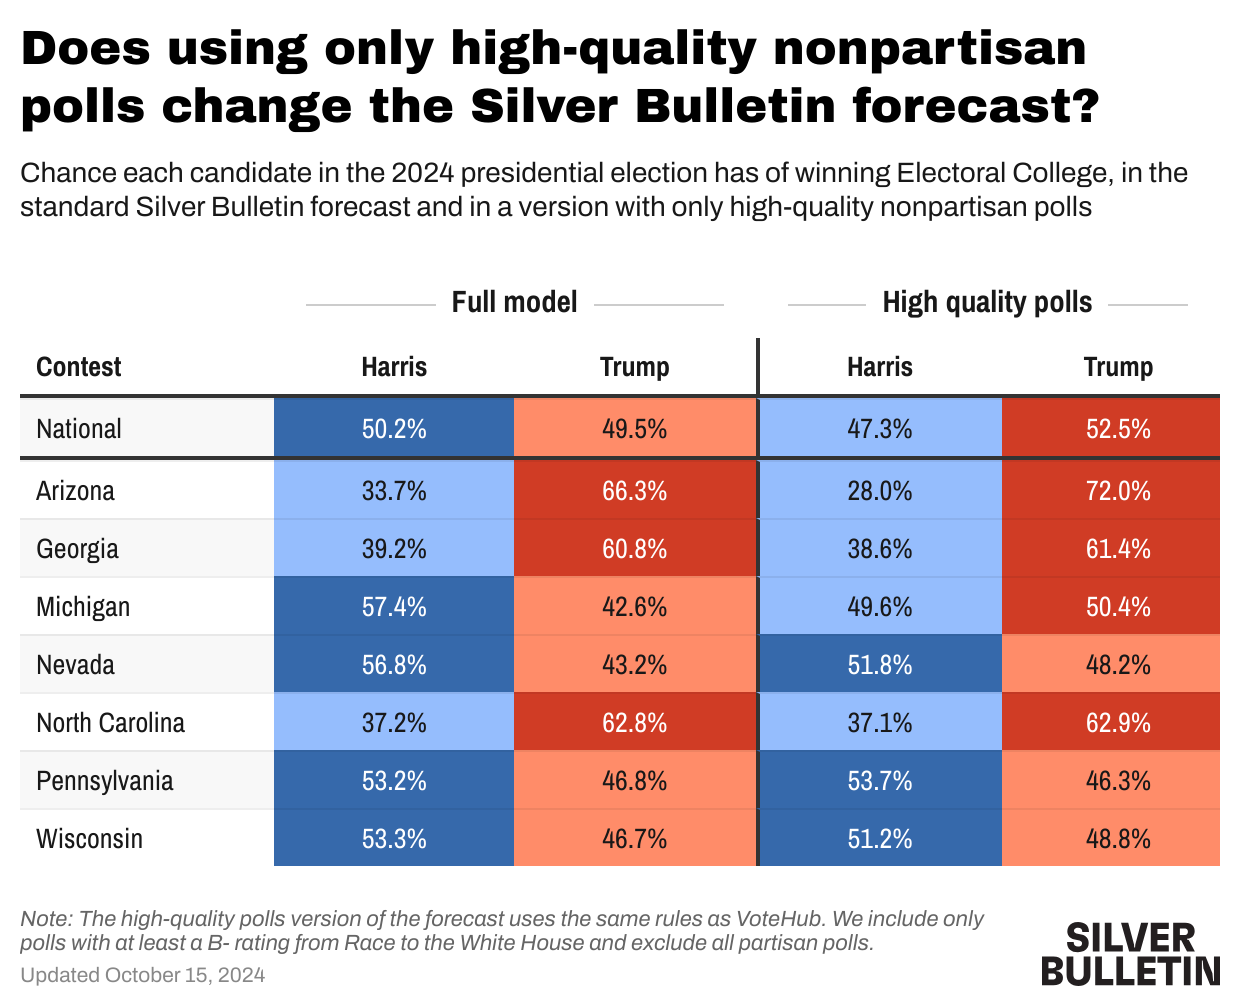
“Rather than speculating about the motivations of every firm, it’s more useful to ask whether a flooding of the proverbial zone could meaningfully move the polling averages. Yes, in theory it could if two things were true. First, polls from Republican-leaning firms are more favorable to Trump than nonpartisan polls. And second, the polling averages don’t adjust these polls based on pollster quality and house effects, allowing them to push the averages right. So the important question here is: are both of these things actually happening?”
Americans are more likely to accept most protest tactics when the protest is for a cause they like
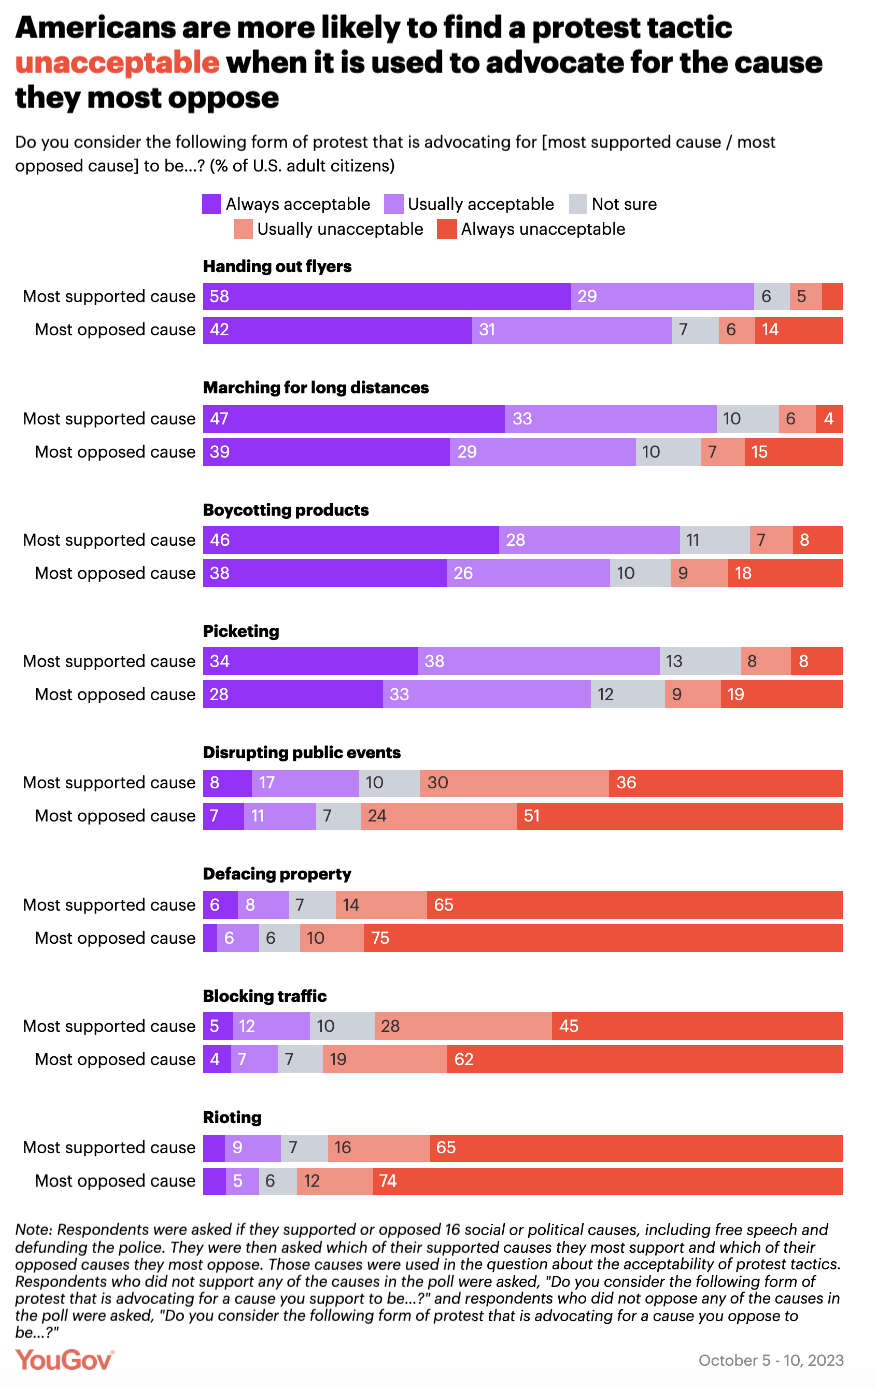
“Americans are more likely to find each of the eight forms of protest acceptable when the protest is advocating for their most supported cause and more likely to find each tactic unacceptable when it is used to advocate for their most opposed cause. The differences are subtle but in a consistent direction. For example, while most Americans find marching for long distances always or usually acceptable, they are twice as likely to find it always or usually unacceptable when the protest is about their most opposed cause (22%) than when it is for their most supported cause (10%). Majorities of Americans also find handing out flyers, boycotting products, and picketing acceptable but are about twice as likely to find each tactic unacceptable when it is used in support of their most opposed cause.”
How question style can influence survey responses: the effect of multiple-select
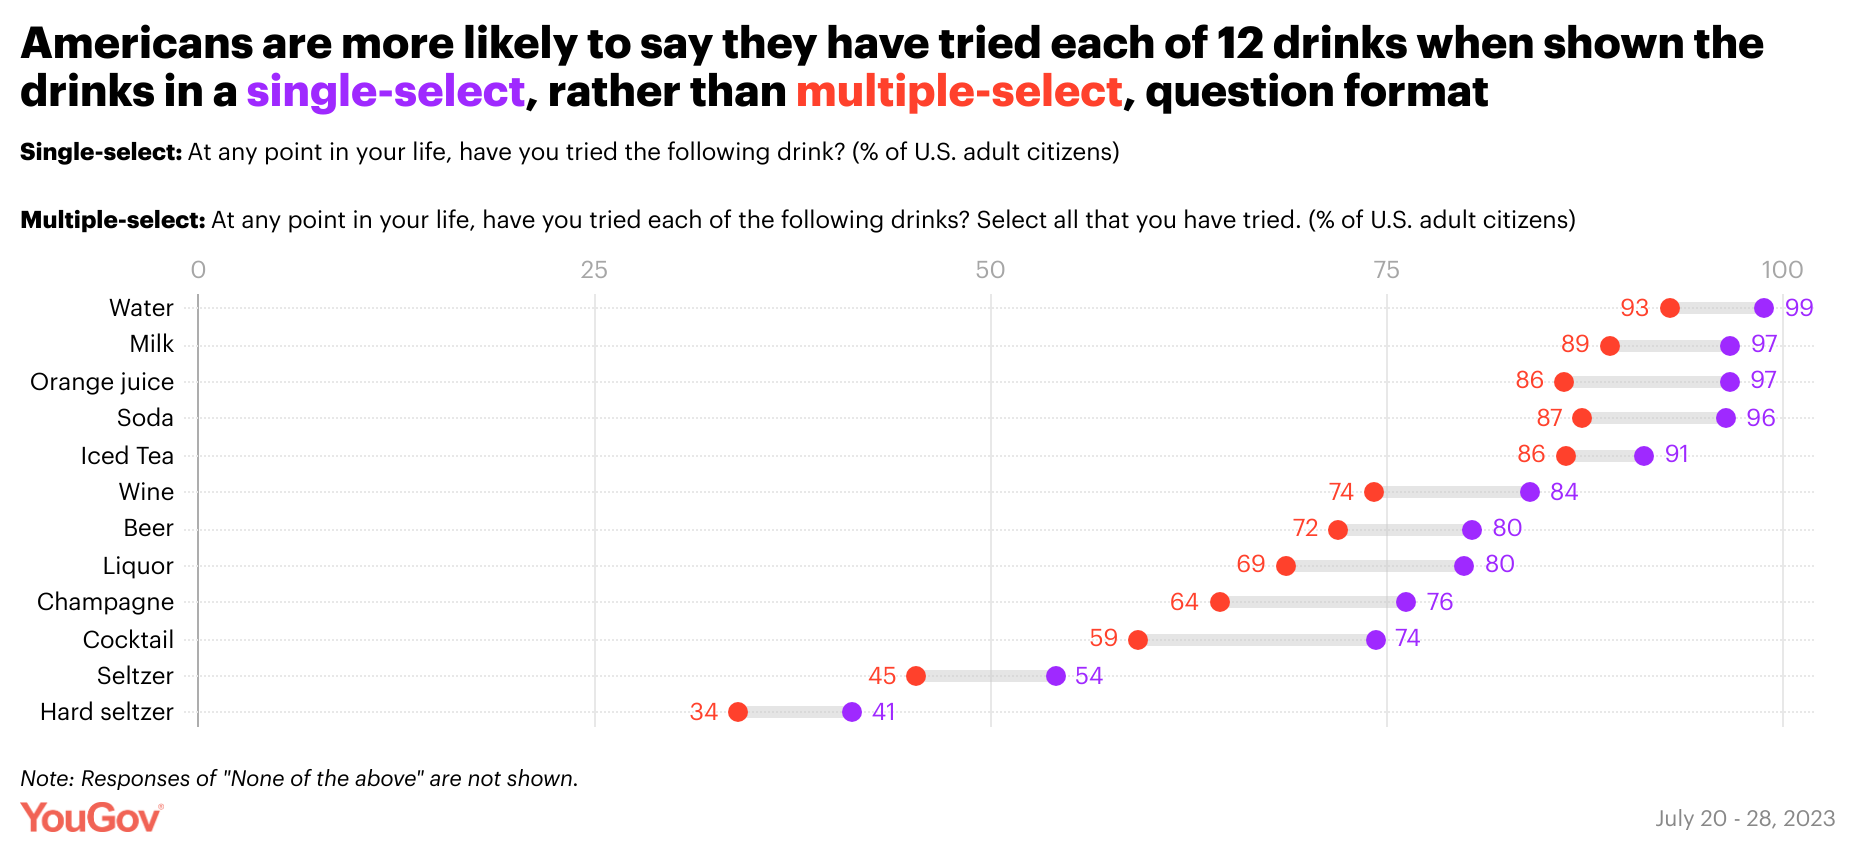
“As with the experience and identity questions, Americans shown each drink in a separate question were more likely to say they had tried them than were Americans who were shown all 12 drinks in the same multiple-select question. For example, Americans in the single-select group (84%) were 10 percentage points more likely than those in the multiple-select group (74%) to say they had ever tried wine. There were similar differences in the estimates of adults who have tried drinks derived from single-select and multiple-select questions for beer (80% vs. 72%), liquor (80% vs. 69%), and champagne (76% vs. 64%).”
Americans’ opinions on state preemption of local laws are driven by partisanship
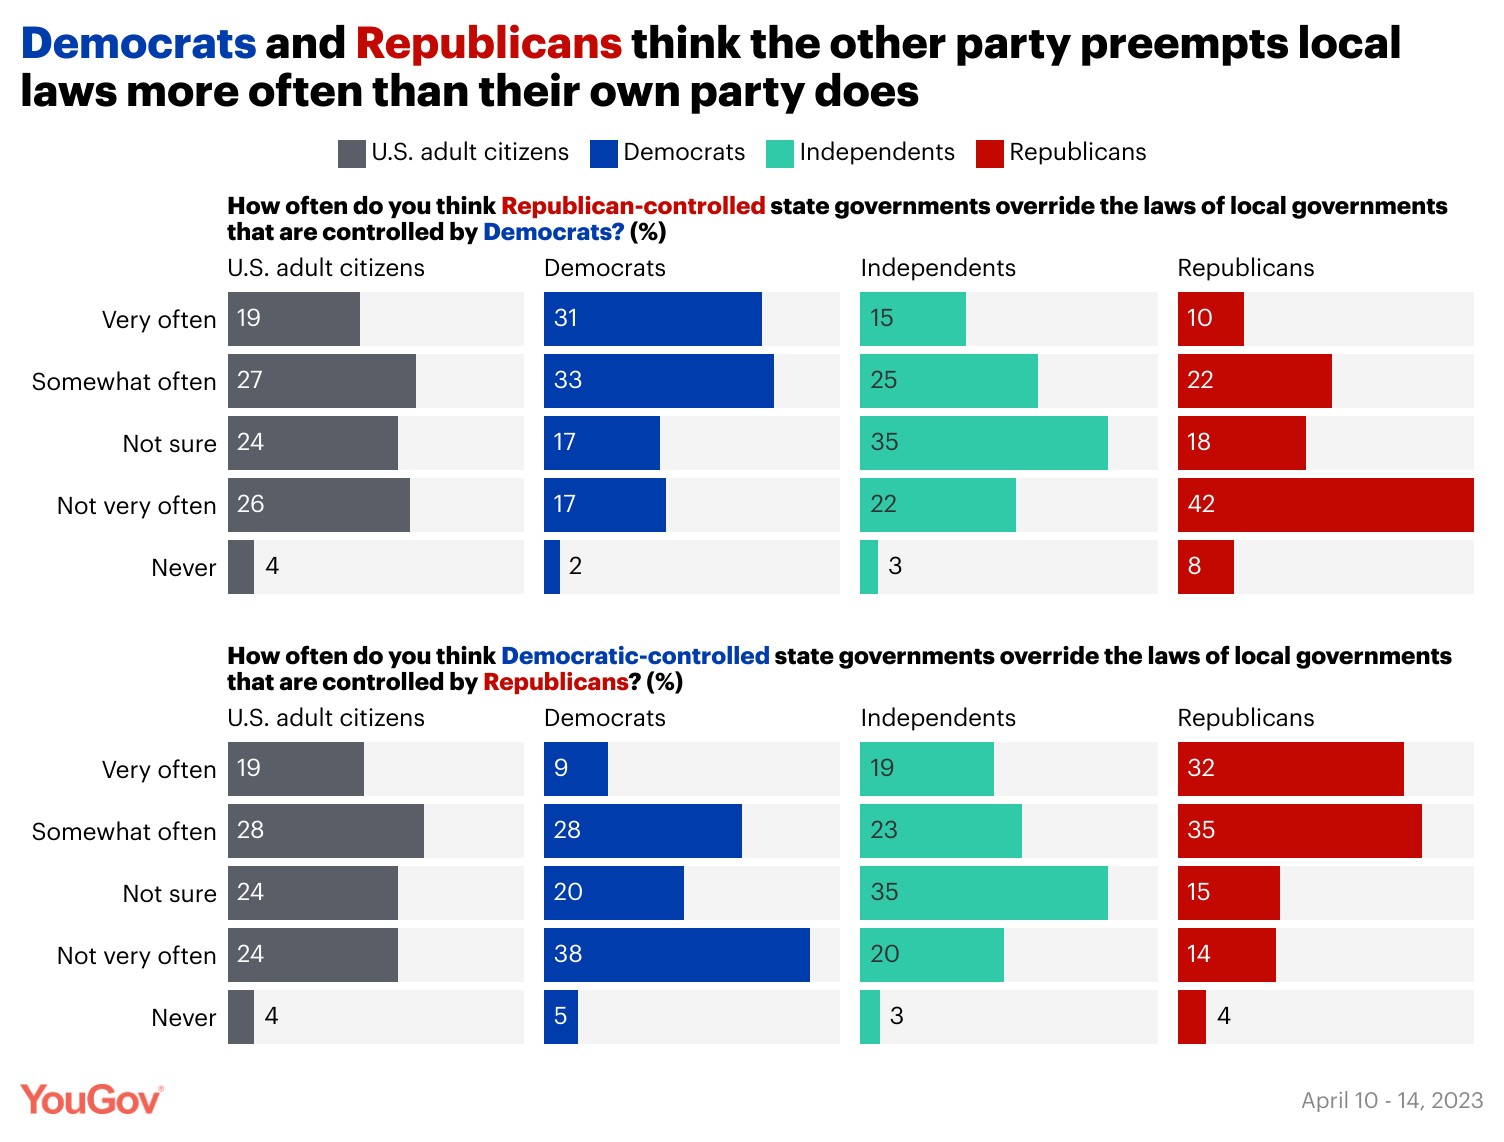
“However, both Democrats and Republicans think that the other party preempts local laws more often than they think their own party does. For example, 64% of Democrats believe that Republican state governments preempt Democratic local governments very or somewhat often, while only 32% of Republicans think the same. Similarly, only 37% of Democrats think Democratic state governments often preempt Republican local governments, compared to 67% of Republicans.”